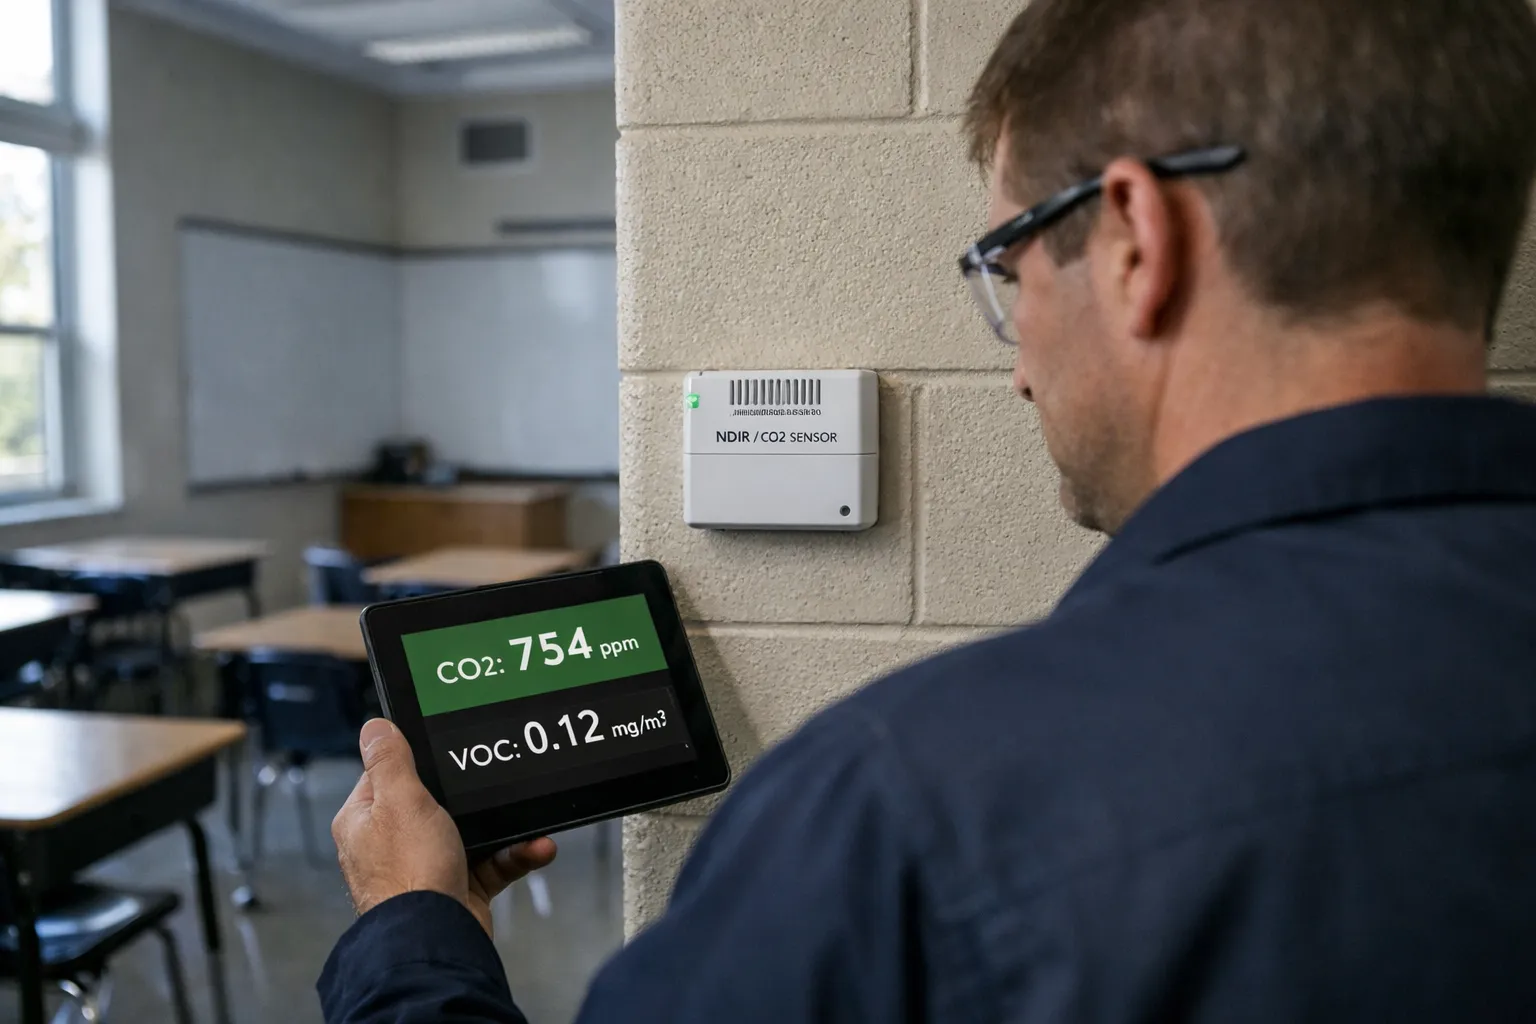
This updated guide (November 2026) helps HVAC systems professionals and school facilities teams design, specify and commission CO2+VOC demand‑controlled ventilation (DCV) for K‑12 classrooms and support spaces. It preserves the practical, field‑ready steps from the original 2026 guide while adding late‑2026 market, regulatory and technical updates: sensor and network security expectations, wildfire smoke/PM monitoring integration, cloud telemetry/analytics adoption, and revised best practices for calibration, procurement and commissioning.
Prerequisites & why this matters now
Who this is for: HVAC designers, commissioning agents, facilities managers and systems integrators working on new or retrofit K‑12 projects. Why it matters: schools balance health, cognitive performance and budgets. CO2 remains the best practical proxy for occupancy‑related ventilation demand; VOC sensing catches non‑occupant pollutant events (cleaning, art supplies, lab odors) that CO2 alone misses. Since early 2024 the market has matured: lower‑cost NDIR sensors with better drift compensation are widely available, cloud‑based monitoring with ML anomaly detection is routine, and districts increasingly specify IAQ monitoring in contracts. This guide shows how to make DCV repeatable, auditable and resilient in 2026 school operations.
Context & requirements to check first
Before design, verify:
- Local code and district IAQ policies (many jurisdictions added monitoring and reporting requirements since 2023—confirm current minimum OA rates and allowable CO2 setpoints).
- Existing HVAC capability: OA damper modulating range, VAV controller programmability, fan static margin and sensor wiring/canopy for digital comms.
- IT/security requirements for field devices: many districts now require device authentication, encrypted telemetry (TLS), and an asset management entry for any IP‑connected sensor.
- Wildfire smoke policy and PM monitoring needs—schools in fire‑prone regions increasingly combine DCV with PM2.5 monitoring and dedicated “high‑PM” modes.
Step‑by‑Step Design and Implementation
1. Establish measurable performance targets
Set clear targets that will guide sensor selection, control logic and commissioning tests:
- CO2 control bands: adopt a primary control target (typical 800–1,000 ppm indoor) and a hard alarm threshold (commonly 1,200 ppm). Document district policy if it differs.
- Minimum OA: enforce code/ASHRAE minimums as an immutable floor (DCV must never reduce below these rates).
- VOC action levels: define warning and purge thresholds in ppb or mg/m³ based on sensor type and manufacturer guidance; define purge duration and maximum OA for VOC events.
- PM response: where PM2.5 monitoring is present, define a high‑PM mode that increases filtration and reduces OA when outdoor PM is unsafe (use EPA AQI thresholds or district policy).
- Energy and reporting goals: quantify expected OA reduction hours per year and reporting frequency. Include data‑logging retention policy (commonly 12–36 months) for audits and grant reporting.
2. Choose sensors and sampling strategy (2026 expectations)
Market and technical updates to consider:
- CO2 sensors: prefer modern NDIR sensors with dual‑wavelength or reference channel designs and documented drift ≤5%/year. Look for units with factory calibration certificates, on‑board temperature/humidity compensation, and explicit support for manual span checks. Avoid ultra‑cheap “baseline‑calibrating” NDIRs without a documented baseline method in continuously occupied spaces.
- VOC sensors: PID sensors remain the preferred choice for general VOC odor detection and low‑ppb sensitivity; advanced MOS sensors with machine‑learning compensation have improved but require more frequent validation. Do not use eCO2 (VOC‑derived CO2) as a CO2 substitute—treat it strictly as a VOC proxy.
- Multi‑parameter IAQ nodes: in 2026, many vendors package CO2+TVOC+PM2.5+temp+RH in a single enclosure with cloud telemetry. These simplify installation but verify each sensor’s individual performance specifications and calibration methods.
- Communications: require BACnet/IP, BACnet MS/TP, or Modbus with documented data objects and secure firmware. For cloud telemetry use MQTT over TLS and ensure the vendor supports RBAC and on‑prem gateway options for districts that disallow direct cloud connections.
- Sampling strategy: one CO2 sensor per typical classroom; larger spaces should be zoned with multiple sensors (auditorium: 3–5 sensors spaced based on occupancy patterns). Co‑locate VOC sensors where odor or contaminant events are likely (art rooms, science prep rooms, cafeterias) and co‑locate PM sensors in buildings susceptible to outdoor smoke infiltration.
- Mounting: breathing‑zone height 0.9–1.8 m (3–6 ft), away from supply diffusers, returns, windows and direct exhalation. Use tamper‑resistant mounts and label sensors with asset IDs consistent with facilities inventory systems.
3. Control logic and BMS integration — updated best practices
Simpler logic reduces failures; new additions in 2026 focus on cybersecurity and resilience:
- Enforce minimum OA based on code/district policy regardless of sensor input.
- Make CO2 the primary control variable with a proportional control strategy (PID or linear). Use setpoint scheduling for different operation modes (school hours, after school, summer).
- VOC handling: define a VOC "warning" and "purge" response. Purges should be bounded by a maximum OA rate and duration to protect thermal comfort and pressurization.
- PM coordination: if outdoor PM2.5 exceeds threshold, automatically switch to high‑filtration/low‑OA mode; ensure DCV logic cannot open OA during an outdoor high‑PM event.
- Anti‑oscillation: implement hysteresis (±40–60 ppm) plus time averaging (1–3 min) and rate limiting on damper travel. Use actuator position rate limits available in modern VFDs or damper actuators.
- Fail‑safe behavior: on sensor loss or communications failure revert to fixed minimum OA, raise fault to the BMS and to remote telemetry, and log events for maintenance response.
- Cybersecurity: require signed firmware updates, device authentication (unique certs), encrypted telemetry (TLS 1.2+), and network segmentation (VLANs) where sensors are IP‑connected.
4. Assess HVAC impacts — fans, filtration, pressurization
Updated checklist:
- Fan capacity: verify fans and coils can accept additional OA during VOC purge events without exceeding motor or coil limits. Include peak purge scenarios in fan schedules and verify VFD and drive thermal protection setpoints.
- Filtration: coordinate MERV or ISO rating upgrades where PM monitoring is present. Use differential pressure monitoring across filters and ensure static pressure reserves remain adequate when filtration is increased.
- Pressurization: model corridor vs classroom pressurization across OA modulation and purge events—use CFD or simplified network models for complex buildings. Ensure door operation and negative pressurization risks are controlled.
5. Commissioning and verification (updated tests and analytics)
Commissioning must validate end‑to‑end performance. Additions for 2026:
- Pre‑installation survey: include an IT/asset entry and firmware baseline for each sensor; capture serial numbers and firmware versions in the commissioning record.
- Sensor functional test: power, communications and span/offset checks. For VOC/PID sensors, document calibration gas and concentration used for verification.
- CO2 decay test: use the standard decay formula (n = −ln[(C(t) − C0)/(Cinit − C0)]/t) to confirm ventilation effectiveness. Run tests during representative thermal conditions when possible.
- OA flow verification: use balometer, tracer gas or fan curve verification. For districts with remote monitoring, cross‑validate BMS OA estimates vs spot measurements and record discrepancies.
- Functional sequence test: verify CO2 response during occupied period, validate VOC purge response with a controlled, safe VOC stimulus (e.g., marker fumes per protocol), and verify PM mode during a simulated outdoor high‑PM condition if safe to do so.
- Data logging and analytics: enable continuous logging for at least two weeks of representative operation and run anomaly detection (look for sensor drift, repeated purges, oscillation). Many vendors provide cloud analytics—use them to identify rooms that never reach target ventilation or show persistent high VOC/PM events.
- Documentation & training: deliver sequence of operations, sensor asset list, calibration schedule, spare parts, and a one‑hour operational briefing for facilities staff. Include step‑by‑step troubleshooting flowcharts for common faults.
Estimating Energy Impact (Practical example, Nov 2026)
Use the same physics as before. Below is a compact, repeatable method with a sample classroom calculation so you can adapt to local rates and operating hours.
- Compute instantaneous avoided heating/cooling load: Q = ρ × Cp × V × (Tout − Tind). Use ρ ≈ 1.2 kg/m³, Cp ≈ 1.006 kJ/kg·K.
- Convert to kW (Q[kW] = Q[kJ/s] / 1,000) and integrate over operating hours where DCV reduces OA.
- Adjust for system heating/cooling efficiency (gas furnace AFUE or boiler efficiency, COP of heat pump) and include fan energy changes from damper movement and VAV rebalancing.
Example (classroom): reducing OA by 200 cfm (~0.0946 m³/s) for 6 hours/day over a 180‑day school year with winter delta‑T 15°C:
Q_inst ≈ 1.2 × 1.006 × 0.0946 × 15 ≈ 1.71 kW. Annual raw energy ≈ 1.71 × 6 × 180 ≈ 1,846 kWh. Divide by heating system efficiency (e.g., 0.85) for fuel equivalence. For accurate budgeting, also model additional fan energy and VOC purge events; use measured runtime data from commissioning logs.
Practical Classroom Example (updated)
- 900 ft² classroom (≈83.6 m²), 30 students, district target CO2 ≤900 ppm and code minimum OA = X cfm.
- Install a factory‑certified NDIR CO2 sensor and PID VOC node co‑located at teacher breathing zone (1.2 m high), wall mounted, tagged in asset system with unique ID and firmware version.
- Configure DCV: maintain minimum OA; modulate damper proportionally from 400 ppm to 900 ppm; VOC purge to maximum OA for 10 minutes if VOC threshold reached but disable purges when outdoor PM2.5 > threshold.
- Commission: CO2 decay test after class, verify OA with balometer, log two weeks of operation, and run analytics to detect drift or rooms that never reach targets. Train facilities staff and hand over a calibration schedule (annual span check for CO2, PID validation every 6–12 months depending on duty cycle).
Maintenance & long‑term performance
- Calibration: schedule annual or biannual verification. For NDIRs with documented low drift, annual spot span checks are typical; for PID/MOS VOC sensors, plan more frequent checks (6–12 months) and document any field recalibrations.
- Data monitoring: retain IAQ logs 12–36 months. Use trend analysis to detect slow sensor drift, sudden step changes (sensor failure), or systemic changes after HVAC work.
- Spares and recovery: keep spare sensors or a tested loaner and a documented rollback procedure. Replace sensors before drift exceeds manufacturer limits to avoid IAQ regressions.
- Re‑commission after changes: new coils, filters, VAV boxes or room re‑use require re‑testing of ventilation effectiveness and recalibration of control gains.
Common Mistakes and how to avoid them
- Poor placement: avoid windows, supply diffusers and direct exhalation; use breathing‑zone height and document locations in the asset list.
- Relying on eCO2: continue to treat eCO2 as an indicator only; install NDIR CO2 for control.
- No minimum OA safeguard: always enforce the code minimum OA as a hard floor.
- Ignoring cybersecurity: require device authentication, signed firmware and encrypted telemetry in procurement documents.
- No maintenance plan: schedule calibration, keep spares, and enable trending alerts to catch drift early.
Pro Tips (for experienced practitioners)
- Specify sensors with serial numbers and firmware locked at shipment; require an asset handover sheet listing firmware, calibration certificates and network configuration.
- Use cloud analytics sparingly—rely on local BMS controls for life‑critical fallback and use the cloud for trending, anomaly detection and district reporting.
- Design VOC purges as bounded events; unrestricted purges can cause large thermal penalties and pressurization issues.
- Include PM sensors in wildfire‑prone districts and test the high‑PM mode during commissioning, including increased filtration checks and fan static reserves.
- When possible, pilot DCV in a subset of classrooms with detailed logging and use results to tune PID gains and action levels before full rollout.
Commissioning Checklist (summary)
- Verify sensor model, serial, firmware and calibration certificate. Record in asset management.
- Confirm placement at breathing height and secure mounting; label with asset ID.
- Test failure modes—sensor offline, comms loss, stuck damper—confirm safe fallback behavior to minimum OA.
- Perform CO2 decay and OA flow verification and record results in commissioning report.
- Validate control sequence under occupied conditions; confirm VOC purge and PM high‑PM behavior.
- Deliver documentation: sequence of operations, calibration schedule, spare parts, and a facilities training session.
FAQ
Do I need VOC sensors in every classroom?
Not necessarily. CO2 sensors should be present in every occupied classroom for occupancy‑based DCV. VOC sensors are most valuable where non‑occupant‑related contaminants or odor sources exist (art rooms, science prep, cafeterias). In practice many districts now deploy a mixed strategy: CO2 in every room and VOC/PM nodes in representative locations plus problem rooms.
How often should CO2 and VOC sensors be calibrated?
For modern NDIR CO2 sensors, annual verification (span check) is common; some devices with advanced reference channels can extend intervals but still require periodic manual checks in continuously occupied spaces. VOC sensors (PID/MOS) typically require more frequent validation—6–12 months depending on duty cycle and environment. Always follow manufacturer guidance and document each check.
Can DCV increase energy costs during purge events?
Yes—VOC purge events and increased OA during occupied peaks temporarily raise heating/cooling loads. Design DCV control to limit purge duration and to avoid purges during outdoor high‑PM conditions; include these events in your annual energy model. Net energy savings usually persist because OA is reduced for extended periods when occupancy is low.
What about cybersecurity and cloud monitoring—must sensors be on the district network?
District IT policies vary. Many schools now require network segmentation, device authentication, and encrypted telemetry. Where cloud connectivity is disallowed, choose vendors that offer an on‑prem gateway or BACnet/Modbus integration so the BMS can collect data without exposing devices to the internet.
How do I handle wildfires and outdoor smoke?
Combine PM2.5 monitoring with your DCV logic. When outdoor PM2.5 exceeds a safe threshold, switch to high‑filtration and reduced‑OA mode, and avoid OA purges. Ensure filters and fans can operate at the required static pressure and test the mode during commissioning.
Conclusion
CO2+VOC DCV remains a high‑value intervention for K‑12 schools—improving occupant comfort and IAQ while saving energy when done correctly. In late 2026 the key additions to practice are stronger procurement and cybersecurity requirements, wider integration of PM monitoring for wildfire response, greater reliance on cloud analytics for trend detection, and improved sensor hardware with lower drift. Follow the steps above—set measurable targets, choose certified sensors, implement simple resilient logic, commission with rigorous tests and maintain a documented calibration program—and DCV will be a reliable part of your school facilities toolkit.