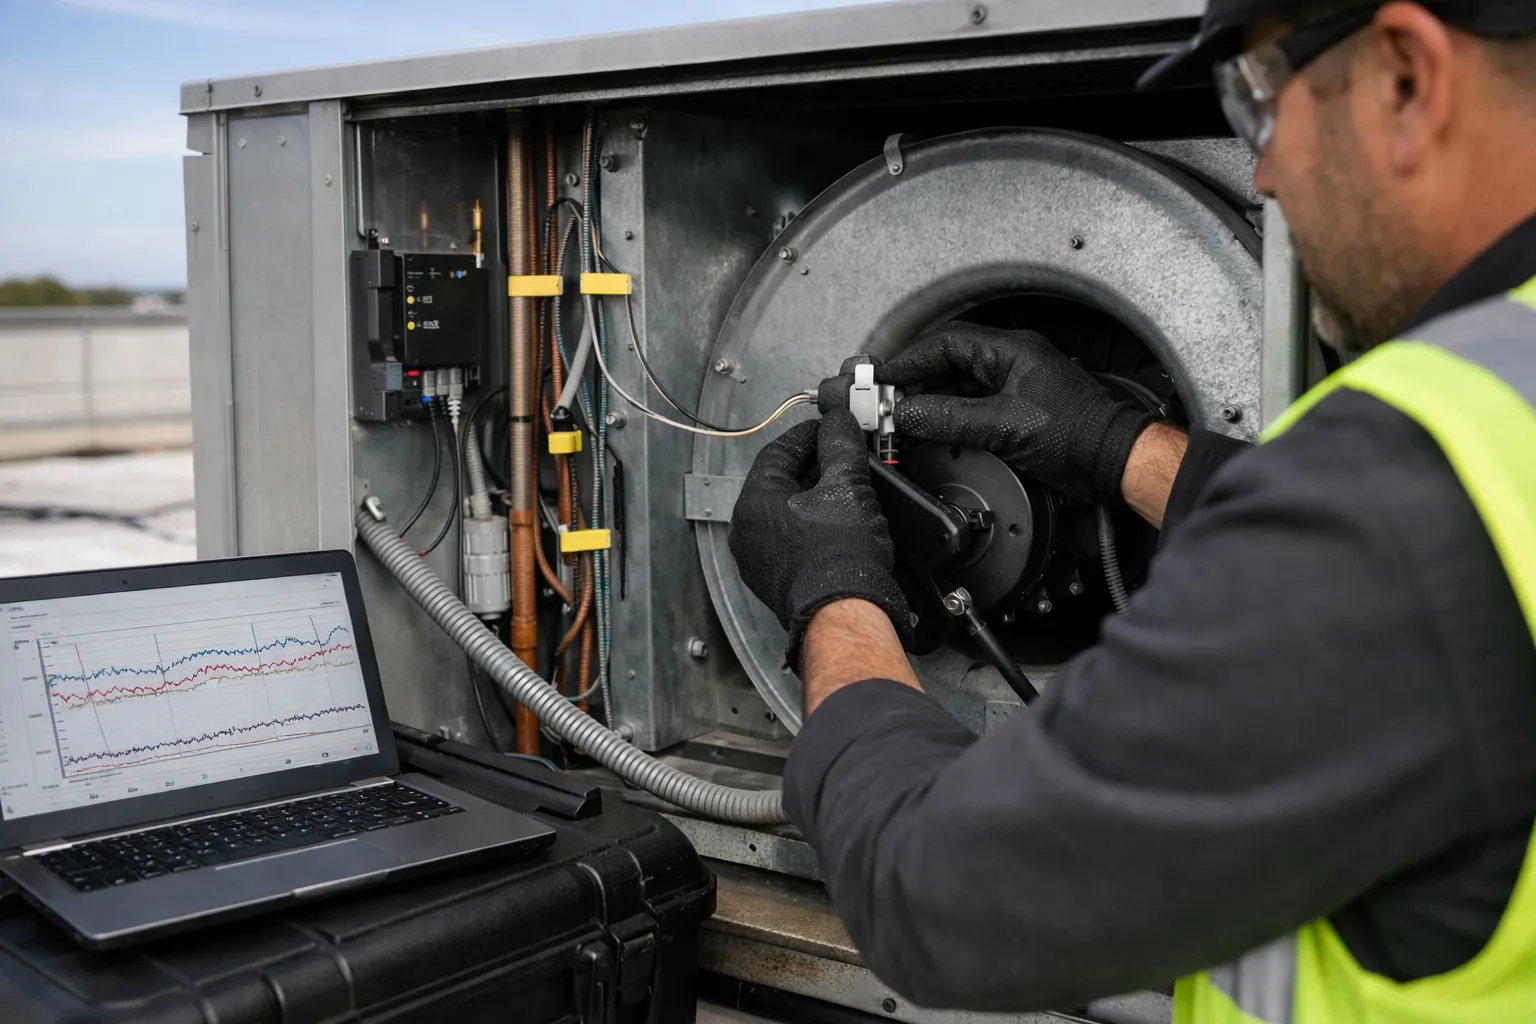
Why sensor fusion for RTU fault detection now?
In 2026, packaged rooftop units (RTUs) remain one of the most ubiquitous commercial HVAC assets—and one of the costliest to operate poorly. Single-sensor alarms (high head pressure, low suction pressure, high discharge current) generate noise and missed faults. Sensor fusion—combining multiple inexpensive measurements and simple analytic rules—lets technicians detect real, actionable faults earlier and with fewer false positives.
This guide walks through a practical, vendor-agnostic process to specify, install, commission, and operate a sensor-fusion fault-detection system for packaged RTUs. It emphasizes pragmatic choices: low-cost MEMS and IoT sensors, edge or gateway-based fusion rules, and commissioning tests you can run in a single site visit.
Typical faults sensor fusion detects
- Dirty/blocked supply or return filters and fouled coils (reduced airflow, rising discharge temp, higher static pressure)
- Fan motor or belt degradation and misalignment (increased motor current with low air flow, vibration signatures)
- Refrigerant undercharge or overcharge and TXV/expansion device faults (abnormal superheat trends, low/high suction/discharge pressures)
- Economizer damper failures or mixed-air issues (mismatch between commanded OA position and measured mixed-air temperature)
- Short cycling and control sequencing errors (rapid supply-temperature swings with corresponding compressor current cycles)
Step 1 — Plan: scope, objectives, and baseline
- Define goals. Example: "Detect filter loading before it increases fan energy by 15% or causes occupant complaints." Prioritize 3–5 high-value faults per RTU.
- Inventory RTU equipment and BAS connectivity. Note model, year, compressors, presence of VFD, and accessible points for pressure/temperature taps and electrical current sensors.
- Baseline performance. Collect 1–2 weeks of existing BAS data (supply temp, return temp, economizer position, compression cycles) to establish operating envelopes and typical diurnal patterns.
Step 2 — Choose sensors and placement
Design sensors to measure independent physical phenomena so fusion provides complementary evidence. Below is a practical sensor list with placement and recommended performance targets.
Core sensor set
- Supply air temperature (Ts): 1 sensor in the supply plenum, ±0.2°C accuracy, 1-min sampling.
- Return/room air temperature (Tr): 1 sensor in the return inlet or common space, ±0.2°C.
- Outdoor air temperature (To): weatherproof sensor near OA intake, ±0.5°C.
- Discharge static pressure (Pd): duct static tap downstream of the fan; ±0.5 Pa or ±0.1 in. WC preferred.
- Airflow proxy: differential pressure across a factory-supplied primary flow element (fan inlet vane or duct pitot) or a calibrated MEMS thermal anemometer in the main supply duct.
- Compressor suction and discharge pressures (Ps, Pdsc): 0–500 psi range depending on refrigerant; use manufacturer pressure ports if available. Accuracy ±1–2% FS.
- Electrical current (I): clamp-on CTs on fan motor and compressor circuits; measure RMS current, ±1–2% accuracy.
- Vibration accelerometer: single-axis or tri-axis MEMS on fan housing or motor bearing, sampling at 1–4 kHz for diagnostic captures; lower-rate RMS (1–10 Hz) for trending.
- Optional: refrigerant line temperature sensors: Ø tubing, near the evaporator outlet and near the condenser, for superheat/subcooling estimates.
Why these sensors?
Combining thermal, pressure, electrical, and vibration signals covers the main physical domains RTU faults manifest in and gives redundancy: a stuck economizer damper shows as an unexpected mixed-air temperature; a clogged filter shows as high static pressure plus low airflow and higher fan current during load; a refrigerant leak shows as changing suction pressure combined with changing superheat.
Step 3 — Data architecture and sampling
Decide where fusion runs: at the sensor edge, gateway, BAS, or cloud. For RTU FDD, a hybrid approach is practical: lightweight rules at the edge/gateway for immediate alarms and richer analytics in the cloud for trending and model updates.
- Sampling rates: 1-min for temperature/pressure/current for trending; 1–5 sec for VFD speed and critical control points if available; vibration capture at high sample rate (1–4 kHz) only when triggered or for short diagnostic windows to limit bandwidth.
- Retention: store 1-min aggregated data for 2+ years for trending; store high-resolution vibration snapshots for 30–90 days unless flagged.
- Time sync: use NTP; timestamp all data in UTC to align multi-sensor fusion.
- Connectivity: secure MQTT/HTTPS to gateway/cloud; plan for intermittent connectivity—local buffer with FIFO to avoid data loss during outages.
Step 4 — Fusion logic: rule sets and algorithms
Start simple. For field deployments, deterministic rule-based fusion gives transparency and fast commissioning. You can add statistical baselining and lightweight machine learning later.
Example fusion rules (practical)
- Filter loading: If discharge static pressure rises >25% above baseline for the same fan speed AND measured airflow drops >15% for 30+ minutes, flag "filter/coil restriction."
- Fan issue (belt slip/motor degradation): If airflow baseline for commanded fan speed AND fan current increases >10% vs baseline for 10+ minutes OR vibration RMS increases >20%, flag "fan mechanical/drive fault."
- Refrigerant undercharge: If suction pressure drops >10% with corresponding increase in compressor current and evaporator outlet temperature rises relative to return air (superheat trend up) across two compressor cycles, flag "possible undercharge/evaporator starving."
- Economizer stuck: If OA damper command >30% open AND mixed-air temperature differs from expected blend (measured mixed-air temp not between To and Tr within ±2°C) for >5 minutes, flag "economizer mismatch/damper drive."
- Short cycling: If compressor cycles more than 4 times per hour for an hour with no change in load, flag "short cycling—control or refrigerant issue."
Use voting or weighted scoring to reduce false positives: each fault type assigns points to supporting sensor events, and a threshold triggers the alarm. For example, the filter-loading rule might assign 3 points for high Pd, 2 points for low airflow, 1 point for higher fan current; require ≥5 points to alarm.
Advanced techniques
- Statistical baselining: create season- and occupancy-aware envelopes from historic data to adapt thresholds.
- State estimation: simple Kalman filters to smooth noisy airflow or pressure signals before applying thresholds.
- Supervised ML models: only after you have labeled fault examples; use for secondary confirmation, not primary alarms.
Step 5 — Commissioning and verification
Commissioning is where the system proves value. Follow a structured test plan and document outcomes.
- Functional checks: verify each sensor reading against reference instruments—handheld thermometers, manometers, clamp meters. Document offsets and apply calibration factors where needed.
- Simulated fault tests: intentionally introduce known faults where safe and permissible—e.g., add a known restriction in the filter rack to validate filter-loading detection; command economizer to closed/open to verify mixed-air behavior.
- Baseline tuning: adjust thresholds based on measured baselines, not manufacturer defaults. Use at least 7–14 days of normal operations to capture variability.
- False-positive run-in: operate for 30–60 days and review alarms. Tune rule weights or add hysteresis (time thresholds) to reduce nuisance alarms.
Step 6 — Workflows and actions
Alarms must lead to clear, rapid actions. Integrate FDD alerts into your work-order or CAFM system with standardized diagnostics and recommended corrective actions.
- Example alert packet: RTU ID, timestamp, fault score, supporting sensor traces (last 60 min), recommended steps (e.g., "inspect filter; check static pressure; measure fan belt tension").
- Prioritization: use a scoring system that combines energy impact (estimated kWh penalty) and risk (equipment damage potential) to prioritize dispatch.
- Verification capture: after corrective work, capture 24–72 hours of post-fix data to confirm resolution and update the baseline.
Costs, ROI and incentive context (2026)
Typical installed incremental hardware cost per RTU in 2026 ranges from $900–$3,000 depending on sensors chosen (vibration and refrigerant pressure taps are cost drivers) and integration complexity. Software and gateway licensing add operational costs—budget $200–$600/RTU-year for cloud services and rule management in many commercial solutions.
ROI is driven by avoided energy waste, deferred maintenance, and reduced emergency service calls. Conservative field estimates: detecting and servicing a clogged filter before a 10–20% fan energy penalty can pay back sensor and modest software costs within 1–2 heating/cooling seasons in most commercial buildings. Check 2026 local utility and state decarbonization incentives—many programs now fund control and sensor upgrades for packaged units.
Practical case vignette
A 2025 small office deployment (8 RTUs) used supply/return temps, static pressure, CTs, and a single accelerometer on each fan. After commissioning the fusion rules, the team identified 12 filter/coil restrictions in the first six months that had not triggered preventive maintenance. Correcting those reduced fan energy by an average of 12% per RTU and eliminated 3 emergency motor replacements that would have cost >$3,000 each. Payback on sensors and integration was achieved in 9 months.
Maintenance, calibration and lifecycle
- Calibrate temperature and pressure sensors annually or per site QA plan. Use simple handheld references and apply offsets in the gateway.
- Inspect vibration mounts and CT clamps during PM visits. Replace adhesives and re-tension CTs as needed.
- Retune rules seasonally (spring/fall) to capture HVAC mode changes and occupancy patterns.
Security and data governance
Follow modern 2026 best practices: secure sensor networks (WPA3 for Wi-Fi, TLS for telemetry), strong device identity, gateway hardening and role-based access to alarms. Minimize sending high-frequency vibration or detailed HVAC metadata offsite unless necessary—retain high-resolution data locally and upload compressed summaries.
Common pitfalls and troubleshooting
- Underspecified airflow proxy: poor placement or uncalibrated MEMS anemometers give misleading airflow trends. Use differential pressure where possible.
- Overfitting rules to a single baseline day. Use multi-week baselines and re-evaluate after seasonal transitions.
- Ignoring mechanical context: a "fan current high" alarm without airflow context often leads to unnecessary motor replacements. Fusion avoids that.
Next steps
Start with one or two high-value RTUs, deploy the core sensor set, and iterate on rules. Document each alarm and corrective action to build a site-specific labeled dataset—this will enable future supervised models that improve detection and reduce false positives.
Sensor fusion transforms noisy single-point alarms into multi-signal diagnostics that technicians can act on confidently. With modest hardware outlays and disciplined commissioning, rooftop unit FDD moves from speculative analytics to routine, verifiable maintenance and energy savings in 2026 operations.